What is the Gartley Harmonic Pattern and How to Spot It?
What is the Gartley Harmonic Pattern and How to Spot It?
As a professional trader, you’re wondering what other trading strategies and techniques you can use to improve your trading performance. If you have yet to hear, the Gartley Harmonic Pattern is something that numerous traders are talking about lately. Especially those who are into deep technical analysis and different trading concepts.
Whether you’re an experienced trader or just learning and getting informed occasionally about it, you should know that there are numerous forms of stock or Forex trading in the market. Harmonic patterns are among those forms that have a slightly different approach to trading.
If you haven’t read it yet, in the book called the “Profits in the Stock Market,” H.M Gartley has explained his newly developed Gartley harmonic pattern in detail. This harmonic Gartley pattern became a huge thing among stock and Forex traders worldwide due to its good risk-reward ratio and high success rate.
So, what is the Gartley Harmonic Pattern all about? Why did it achieve major success among devoted traders globally?
The Gartley Harmonic Pattern – what is it exactly?
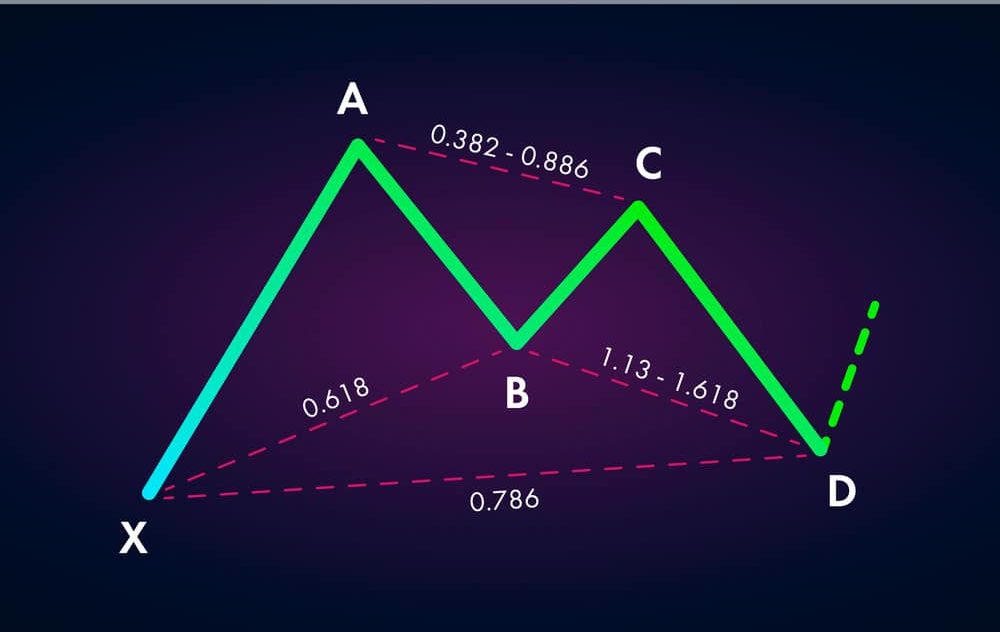
The Gartley Harmonic Pattern represents the particular harmonic chart pattern that assists traders in spotting reaction highs and lows. It’s based on Fibonacci ratios and numbers representing a sequence of numbers from zero to one.
In his book, H.M. Gartley described the basis for Harmonic chart patterns back in 1935. Among numerous other chart patterns, the Gartley pattern is undoubtedly the most used harmonic chart pattern.
Generally speaking, Gartley patterns must be used in conjunction with numerous forms of tech analysis. These forms could act as confirmation.
What is the key benefit of this pattern?
The key benefit of the Gartley Harmonic pattern is that these types of patterns enable particular insights into the magnitude and timing of price movements, which is crucial for success in any trading market.
On what principle does the Gartley harmonic pattern work?
The Gartley Harmonic Pattern refers to the most common harmonic chart pattern that works on the proposition that Fibonacci sequences are utilized for creating geometric structures in prices such as:
- Retracements: These identify a minor change or pullback in the direction of the stock or index.
- Breakouts: Identifies the time when the assets’ price moves either above the resistance area or below the support level.
The Fibonacci ratio has become extremely popular among professional traders that utilize Fibonacci tools. Also, tech analysts utilize the Gartley pattern and other technical indicators and patterns.
For instance, the Gartley harmonic pattern could provide a clear indication of where the price will probably go over the long-term period. At the same time, the traders would emphasize the execution of short-term trades in the predicted trend’s direction. It’s crucial to remember that traders often utilize breakdown and breakout price targets as resistance and support levels.
How to point out and draw Gartley Harmonic patterns the best?
To identify the Gartley Harmonic pattern among numerous other patterns, it’s crucial to know the following information:
- The Gartley Harmonic pattern most commonly resembles a “W” or an “M” shape. The price action in a chart makes the shape. The Bullish Gartley Pattern will have an “M” letter shape, while the Bearish Gartley Pattern will look like a letter “W.”
Drawing the Gartley Harmonic Pattern
To successfully draw the Gartley harmonic pattern, here are some basic steps any trader needs to take:
- Start the movement in the X and then continue to the A.
- Keep in mind that the gap between A and B has to be near 61.8% of the movements’ size from X to B.
- The retracement between B and C has to be either 38.2% or 88.6% of the past A to B movements.
- Regarding movement from C to D, it has to be approximately 127.2% to 161.8% of the B to C movement.
- In case C to D is completed, it’s crucial to measure the A to D movement. Ensure that it’s generally 78.6% of the X to A movement.
Remember to always place your profit target and stop-loss in whichever Gartley pattern you encounter. In the graph explained in the steps above, it’s best to place your stop-loss beneath D and X points. Traditional traders should put their profit target near C, for instance.
What are the main rules of the Gartley Harmonic Pattern?
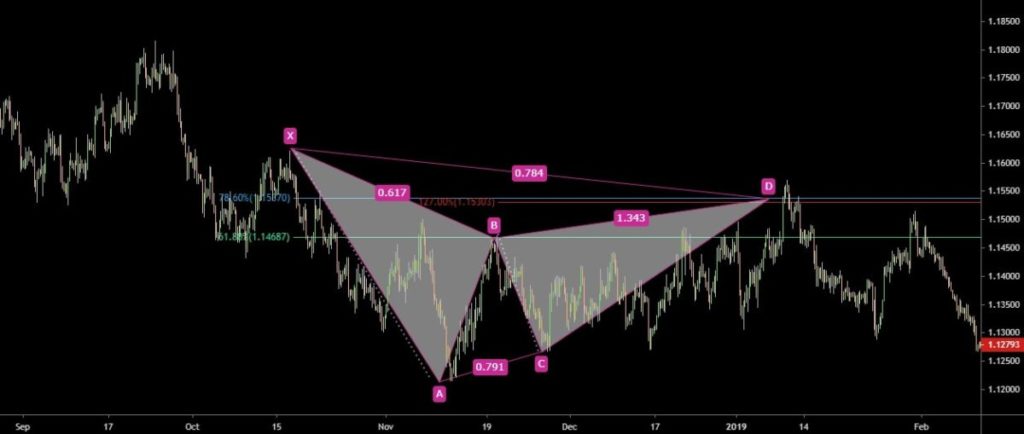
Any trader has to follow some specific rules of the Harmonic Gartley Pattern. Being a part of the Harmonic family, it’s obvious that the Gartley Harmonic Pattern’s every swing needs to conform to particular Fibonacci levels. Let’s take a look at every single component of the famous Gartley structure:
- The AB move has to be about 61.8% of the overall size of XA. If the XA move turns bullish, then the AB move has to reverse the price action. The result would be the XA Fibonacci retracement of 61.8%
- The XA could represent any price activity on the Gartley Harmonic chart.
- The BC move has to reverse the AB move. Simultaneously, there are two potential finishes of the BC moves: Either on the 88.6% Fibonacci level of the past AB leg or the 38.2%.
- The CD is a reversal of the BC. If the BC is about 38.2% of AB, the CD has to answer to the 127.2% of the extension of BC. In a situation where BC is 88.6% of AB, the CD has to result in 161.8% of BC’s addition.
- The ultimate rule of the Harmonic Gartley pattern is the AD. Once the CD move is over, it’s time to measure the famous AD one. A rational Gartley on the chart will present the AD move, about a 78.6% retracement of the XA move.
This is the visual image of the Bullish Gartley Pattern:
Keep in mind that the Bearish Harmonic Gartley pattern represents the inverse of the Bullish Gartley harmonic pattern.
How to trade the Gartley Harmonic Pattern?
Now that you’re familiar with the basic rules of the Gartley pattern, it’s time to learn the simple and effective way of trading it. A Gartley pattern is normally a sign that the original “X to A” trend is about to restart.
Once the pattern completes, the market would reverse once again at D, signaling the end of that retracement. Regarding the bearish Gartley harmonic pattern, traders are able to trade this particular move by opening an opening position at the D. In case the pattern is bullish, it’s crucial to open a “buy position.”
The bearish and the bullish Gartley Harmonic Pattern in Forex
When it comes to the Forex market, here is what it’s crucial to know about the Bearish and Bullish Gartley Harmonic Pattern:
The Bearish Gartley Harmonic Pattern
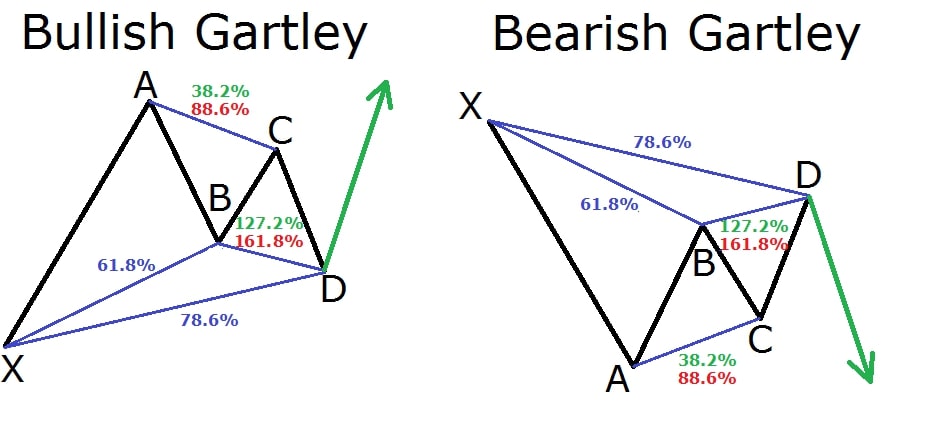
The Bearish Gartley pattern is opposite to the Bullish Pattern, and it’s often referred to as the continuation and retracement pattern. Nonetheless, this pattern proposes that a sell signal could be appropriate instead of a buy signal.
This particular pattern is a valid downward move in price that’s been pursued by numerous retracements. Here’s an example of the GBP/USD chart that shows the Bearish Gartley pattern the best:
The Bullish Gartley Harmonic Pattern
Regarding the foreign exchange market, the Bullish Gartley harmonic pattern is usually used for identifying a valid buying opportunity. It’s a continuation and a retracement pattern that projects the addition of an uptrend. Here’s an example of the GBP/USD chart that shows the Bullish Gartley pattern the best:
Trading the Gartley Harmonic Pattern in the Forex market
If you are a passionate Forex trader, you’d want to know how to best trade the Gartley Harmonic Pattern in the Forex market. If you want to execute a bearish or bullish Gartley trade, keep in mind that it involves creating the pattern, defining market entry, plus locating profit targets, and stopping losses.
Market Entry
It offers flexibility to the trader when it comes to market entry. It offers to buy and sell opportunities that depend upon the various conditions in the market. Usually, once the C-D leg retraces at 78.6% of Z-A, a directional move is when traders choose to buy or sell. The timing and profitability of bullish or bearish trade have improved.
Stop Loss

Stop loss placing is relatively easy. It’s done above or below the Z-A leg origins. Its potential reversal zone looks like that:
- The stop loss is above the Z-A leg for a Bearish Gartley pattern.
- The stop loss is beneath the Z-A leg for a Bullish Gartley pattern.
Profit Target
With the Gartley pattern, profit target localization is rather subjective. Anyways, one method utilizes retracements level as downside or upside targets. For example, a trader can draw a Fibonacci retracement in a Bullish Gartley pattern from the highest A point to the lowest D. Once done. Profit targets could be placed at either 78.6% or 61.8%.
Key Takeaways
- Gartley Harmonic Pattern refers to a harmonic chart formation. It’s constructed on the Fibonacci sequence basis. The pattern is created for the stock market. However, it’s suitable for any product, instrument, or market, such as the Forex market.
- It’s the most utilized harmonic pattern in technical analysis.
- Traders use the Gartley pattern to project potential new bullish and bearish price action in the foreign exchange market.
- This pattern is considered a retracement and continuation pattern that happens once a trend reverses temporarily before returning to the original direction.
The post What is the Gartley Harmonic Pattern and How to Spot It? appeared first on FinanceBrokerage.


