USD/CHF & USD/JPY Analysis: Key Levels and Opportunities

Overall Analysis
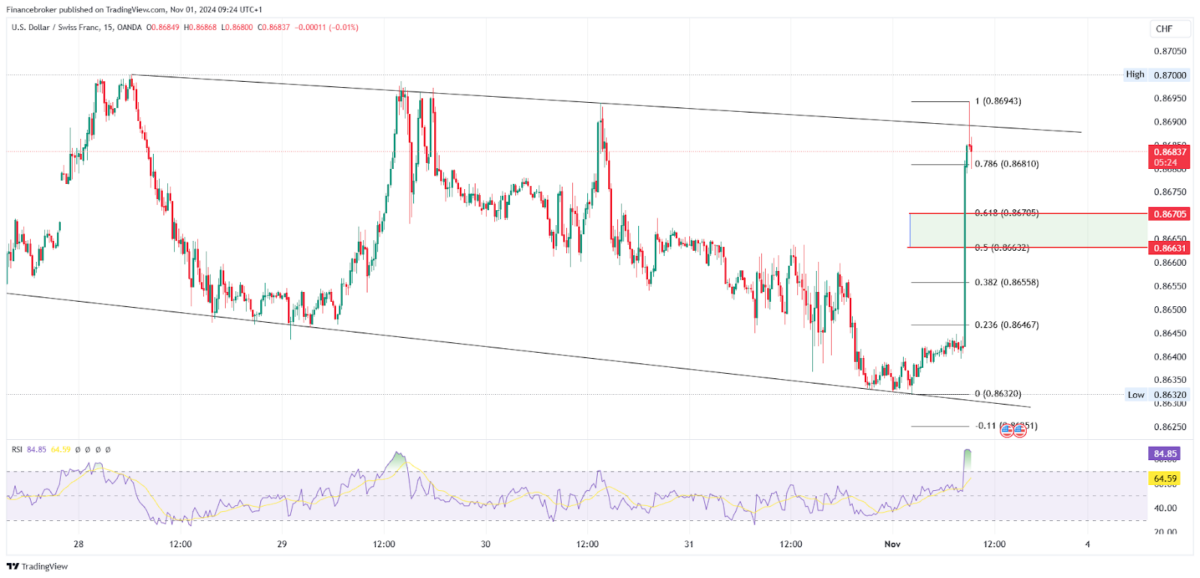
- USD/CHF continued its rally towards the downside, but the price quickly reversed from the support area towards the resistance.
- In USD/JPY, sellers keep pressuring the market, but buyers continue breaking their swings and trying to push the market high.
USD/CHF Chart Analysis
 USD/CHF 15-Minute Chart (Source: TradingView)
On the 31st Oct 2024 the pair was continuously in the selling zone, creating a choppy market condition. Price followed the channel pattern and retested the support zone, creating a channel pattern.
Price sharply reversed from the support area, indicating the strength of the zone. On the 1st Nov trading session, we can see the price again shoot up to test the resistance areas and face rejection from the same. The price has tested the resistance area three times, indicating weakness in the trendline.
There are chances of multiple entries which a trader can plan, and both buying and selling positions can trigger.
Recently, the price shot up, indicating strong buyer interest. However, within just a 15-minute candle, the price surged upward, prompting instant profit-taking. This action may lead to a price correction, providing more opportunities for new buyers to enter.
If planning to enter, then we can use the Fib retracement tool to spot entry.
- If the price comes and retests 0.6 and 0.5 levels and takes support from that level, then entry can be planned on the basis of the targets of 0.86900, and if resistance breaks, then one must use the trailing stop loss method, fix stop loss will be below 0.5 level.
- If the price breaks the 0.5 level and closes below it, then entry can be planned based on candle closing with the stop loss above 0.6 and targets of 0.86398 or till the support trendline.
- If the price hovers around the resistance trendline and creates a rectangle channel with 4-6 candles, then one can plan to buy a side entry if the price breaks the channel and closes above it with a stop below the previous swing low and target of 0.87291 on trailing stop loss basis.
EUR/GBP Chart Analysis

EUR/GBP 15-Minute Chart (Source: TradingView)
In the trading session on October 31, 2024, the pair faces a massive price correction. On a higher time frame market broke the 0.5 Fib retracement level of the previous swing, indicating a trend reversal in the market.
After correcting the price on October 31st, we observe a sharp correction accompanied by the formation of a cup and handle pattern. If the price comes near the 152.969 level, then a cup and handle pattern will activate.
Price is continuously crossing the previous swing’s 0.5 level, which indicates buyers are not ready to let go of the market in selling.
If planning for an entry, then one must enter after the price reaches the 152.969 level and create a zone near the area. One can enter if the price breaks the zone and closes the candle, with the stop loss below the previous swing low and targets of155.536 and 153.841.
The post USD/CHF & USD/JPY Analysis: Key Levels and Opportunities appeared first on FinanceBrokerage.


