Gold & Silver Analysis: Key Levels & Trendline Insights

Overall Analysis
- Gold breaks the long-term supporting trendline and sustains below it. Previous buying swings are still intact.
- Silver fell sharply on 6th Nov trading session, currently moving sideways, trying to hold level.
Gold Chart Analysis

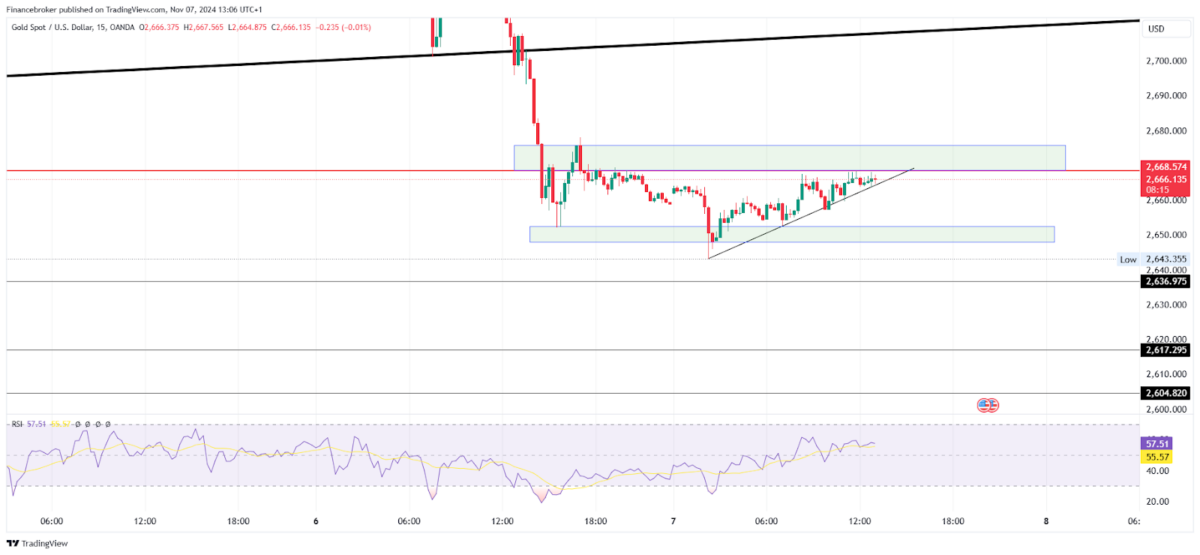
Gold/USD 15-Minute Chart (Source: TradingView)
On the 6th Nov 2024 trading session, gold broke the major supporting trendline and made a low of $2,652. Price continued falling, making a new low of $2,643 on 7th Nov and moving in a zone creating volatility.
On a daily time frame price was moving in an upward channel where it was moving up while creating swings. Furthermore, as the market broke the supporting trendline, previous swing lows are still intact; the price will face heavy selling once it breaks the $2,604 level and sustains below it.
Currently, the price is moving in a channel with support at $2,648 and resistance at $2,675. Gold recently made a new all-time high and has since reversed from the higher levels. This can be a distribution zone where more profit booking can be seen.
There are a few entry triggers:
- If the price breaks the support level of $2,648 and sustains below it, sellers can plan an entry. The stop loss should be set above the previous swing high, with targets at $2,636 and $2,617.
- Currently, the price is moving in a trendline between support and resistance. If the price breaks below the trendline and holds, sellers can create a position with a stop loss placed above the previous swing high and a target set at $2,648.
Silver Chart Analysis

Silver/USD 15-Minute Chart (Source: TradingView)
On the 6th Nov 2024 trading session, Silver broke the major support level and fell sharply around -4.5% and made a 30.816 low. Furthermore, after a sharp fall and high volatility market continued its movement in a sideways direction on 7th Nov.
On the daily timeframe, the price can be seen breaking its long-term channel and falling sharply, but previous swings are still intact. More selling will trigger once the price breaks the 30.250 level and sustains below it, as it will change the uptrend into a downtrend.
Currently, the price is moving in a tight zone where 31.2 is acting as resistance and 30.9 as support. After a sharp fall, the price is taking a halt at this level, and there are few entries one can follow to make an entry.
- If the price breaks the 30.920 level and holds below it, sellers can plan an entry with a stop loss placed above the previous swing high and targets set at 30.250 and 29.877.
- If the price breaks the 31.230 level and holds above it, buyers can plan an entry with a stop loss placed below the previous swing low and a target of up to 31.599.
The post Gold & Silver Analysis: Key Levels & Trendline Insights appeared first on FinanceBrokerage.


