AUD/USD Tests Key Support; AUD/NZD Trading in Sideways Rally

Overall Analysis
- AUD/USD started the day with massive selling as prices fell sharply since opening. Pairs are currently near a strong support zone.
- AUD/NZD is moving in a zone; safe trading opportunities are on the way.
AUD/USD Chart Analysis

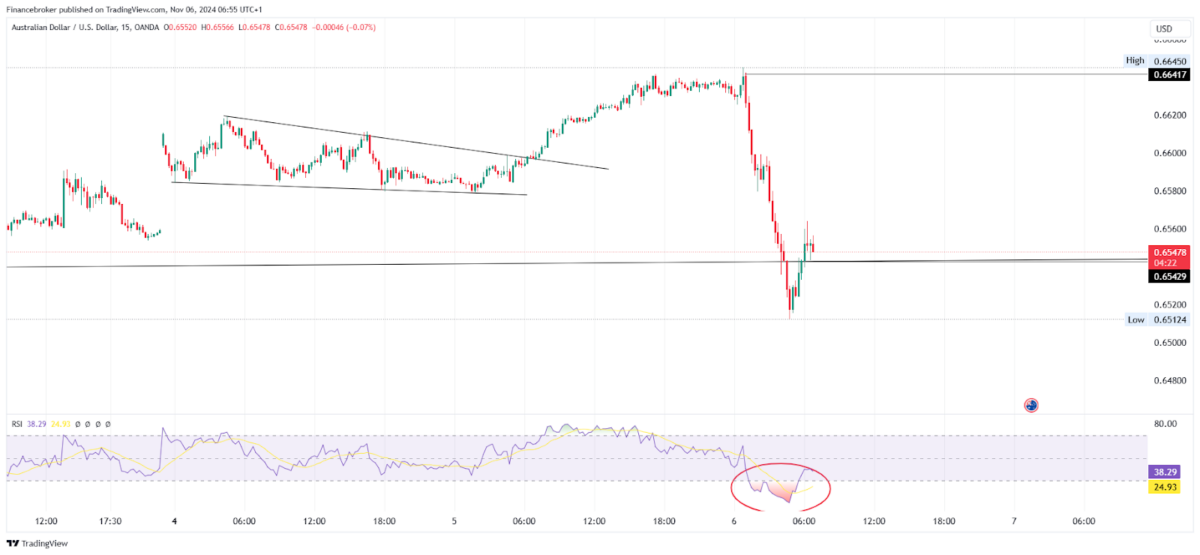
AUD/USD 15-Minute Chart (Source: TradingView)
On the 5th Nov 2024 trading session, the AUD/USD can be seen moving upside down slowly. The pair had broken falling wedge patterns and kept moving up. On 6th Nov, just after opening, the price fell sharply and went down nearly -1.80%, near the support zone.
Looking at the pairs on a daily time frame, the Australian Dollar price can be seen moving upside while taking strong support. Currently, the price is at the support trendline from which it took support 3 times. Closing of the daily candle below the trendline (0.65373) will trigger massive selling, as the price will fall sharply.
Currently, in the 15-minute time frame, the price fell sharply since opening and tried breaking the supporting trendline but failed to do so as it was strong support and RSI went into an oversold zone.
If planning for an entry trigger, then there are a few mentioned below.
- If the price breaks 0.65429 and sustains below it on a daily candle, then one can enter with a stop loss above the previous swing in 15 min and target 0.64740.
- If the price rejects from 0.65429 level and sustains above it, then buy-side entry can be planned on a 15-minute time frame with stop loss below the previous swing low and target till 0.66402
Please note due to the current election, there is high volatility in the market; plan accordingly.
AUD/NZD Chart Analysis

AUD/NZD 15-Minute Chart (Source: TradingView)
On the 5th Nov 2024 trading session, the AUD/NZD pair can be seen moving upside. It is creating higher high and higher low price action, representing a trendy market. Price faced rejection from the 1.10738 level by the end of the trading session, respecting resistance.
On a daily time frame, pairs can be seen moving in a channel-like structure. In this period, 1.10738 acts as a resistance and 1.09853 as support. The price of the Australian vs New Zealand Dollar has been in the zone since 3rd Oct 2024. This channel can be considered as a distribution zone where buyers are off loading after achieving their targets and new traders making entry.
Currently, looking at the pairs on a 15-minute time frame, the price can be seen rejecting from the 1.10738 level, which was a resistance zone.
If planning for an entry, then there are a few entry triggers mentioned below.
- If the price rejects from 1.10379, which is 0.5 fib retracement level. Then selling entry can be made with a stop loss above the previous swing high and target till 1.09853
- Enter a buy position if the price rejects the 1.09853 level, setting a stop loss below the previous swing low and targeting 1.10297 and 1.10738.
The post AUD/USD Tests Key Support; AUD/NZD Trading in Sideways Rally appeared first on FinanceBrokerage.


